ABC-NMR
Quantum Mechanical Treatment of a Three Proton System
Prepared by
Frank Rioux
In this computer/spectroscopy lab the variational method is used to determine
the nuclear spin states and allowed transitions in a three proton spin system.
The theoretical procedure is essentially the same as that used in the other applications
of the variational method that we have studied (LCAO-MO for H2+,
Roothaan SCF, and various examples presented in class).
To prepare for this lab study the section on NMR in your textbook and review
your class notes on the quantum mechanical treatment of the NMR spectroscopy
of one- and two-proton systems. This lab will compare the low field NMR spectra of vinyl
acetate and acrylonitrile. The high field (300 MHz) NMR spectrum of acrylonitrile will be
measured and analyzed, and compared to the 60 MHz spectra of vinyl
acetate and acrylonitrile.
The major steps in this exercise are listed below. Further detail is provided
following the list. As you examine this sequence of steps you will see the
similarities with previous variational calculations that we have looked at in
class and lab.
- Choose a trial nuclear spin wavefunction.
- Write the energy operator for the three spin system which includes all
the pertinent interactions.
- Input parameters (in this case chemical shifts and coupling constants)
and evaluate the matrix elements of the secular determinant for the system.
- Solve the secular determinant for the energy eigenvalues and
eigenfunctions.
- Using the appropriate selection rule, DIz = ±
1, construct a transition probability matrix.
- Using the results from parts 4 and 5 above, calculate the allowed
transitions and their intensities and then generate a model spectrum.
- Compare the theoretical generated spectrum with the
experimentally determined NMR spectrum.
Fortunately for us, the computer does most of the work and certainly all
the difficult math in this exercise.
- A molecule with three protons can be in any of eight possible spin
states. To determine these states we choose as our trial wavefunction
the following linear combination.

In this particular notation, |aaa> stands for all three
nuclear spins in the spin-up (Iz = +˝) spin state, while |aba> indicates that nuclei 1 and 3 are in the spin-up
state and nucleus 2 is in the spin-down state (Iz = -˝). In the absence
of an external magnetic field and any interaction between the protons, all
eight states have the same energy.
- The energy operator representing the interaction of a proton with an
external magnetic field is
where gn is the nuclear g-factor, bn
the nuclear magneton, Bz the magnetic field strength, and Iz
the nuclear spin angular momentum operator in the z-direction.
Because of shielding effects caused by electron density in the neighborhood of
the proton, this equation is re-written as,
where s is the chemical shift caused by the shielding effect.
If there is more than one proton in a molecule, spin-spin coupling
(proton-proton interaction) can occur because each proton is a magnetic
dipole. The energy operator for this type of interaction is
where Jab is the coupling constant between the spins, and Ia and
Ib are the spin angular momentum operators for nuclei A and B.
The complete energy operator is the sum of equations (3) and (4). There is a
term like (3) for each proton and there is a term like (4) for each distinct
pair of protons. For a three proton system, ABC, we have,

- We are now ready to apply the variational method as outlined earlier in
your text. The variational integral for this application is
Treatment of this integral by the usual techniques yields an 8 x 8
secular determinant of the form:
where the diagonal matrix elements are, for example, of the form
Here the ni represent the terms
gn bn (1 - si)
Bz which are the resonant frequencies of the protons in their
respective chemical environments. The various matrix elements can be evaluated
once the chemical shifts and coupling constants are supplied.
- The Mathcad document which is appended solves the secular
determinant (7) after chemical shifts and coupling constants are provided. It
yields the nuclear spin energy levels, their associated wavefunctions, the allowed
transitions between these levels, the frequencies at which the transitions
occur and their intensities. It also generates a model spectrum. Study the
Mathcad document to make certain you understand each of the steps in this
quantum mechanical calculation.
- The calculation of the allowed transitions deserves further comment.
Because the three proton system has eight spin states, there are 28 potential
transitions amongst these energy levels. How many transitions are actually
observed and at what intensities is determined by the selection rule for NMR
spectroscopy. This selection rule states that only one spin can be flipped
in any given transition. In other words D
Iz = ± 1.
A transition is allowed if the product of the three matrices shown below is
non-zero. The intensity of the transition is equal to the square of the
product of these matrices.
For example this matrix determines whether the transition from state 1 to
state 2 is allowed. The matrix on the left contains the coefficients of the
wavefunction of state 1 written in row-matrix form, while the matrix on the
right contains the coefficients of the wavefunction of state 2 written in
column-matrix form. The center matrix is the transition matrix and is an 8x8
square matrix which summarizes the allowed transitions. For example, the
(1,1) matrix element represents the |aaa> --->
|aaa> transition and is 0 because it violates the selection
rule (no spins are flipped). However, the (1,2) matrix element is 1 because
the transition |aaa> ---> |aab>
is allowed (only one spin is flipped). Following the rules of matrix
multiplication, Mathcad examines each possible transition. If its intensity
is non-zero it makes a record of it and later displays the transition in
tabular and graphical form. For example, the matrix product shown below
indicates that the |aaa> ---> |bbb>
transition is forbidden.
Experimental:
The 300 MHz NMR spectrum of acrylonitrile will be measured and compared to
its 60 MHz NMR and also to the 60 MHz spectrum of vinyl acetate.
H O
| |
H - C - C - O H N ş C H
| \ / \ /
H C = C C = C
/ \ / \
H H H H
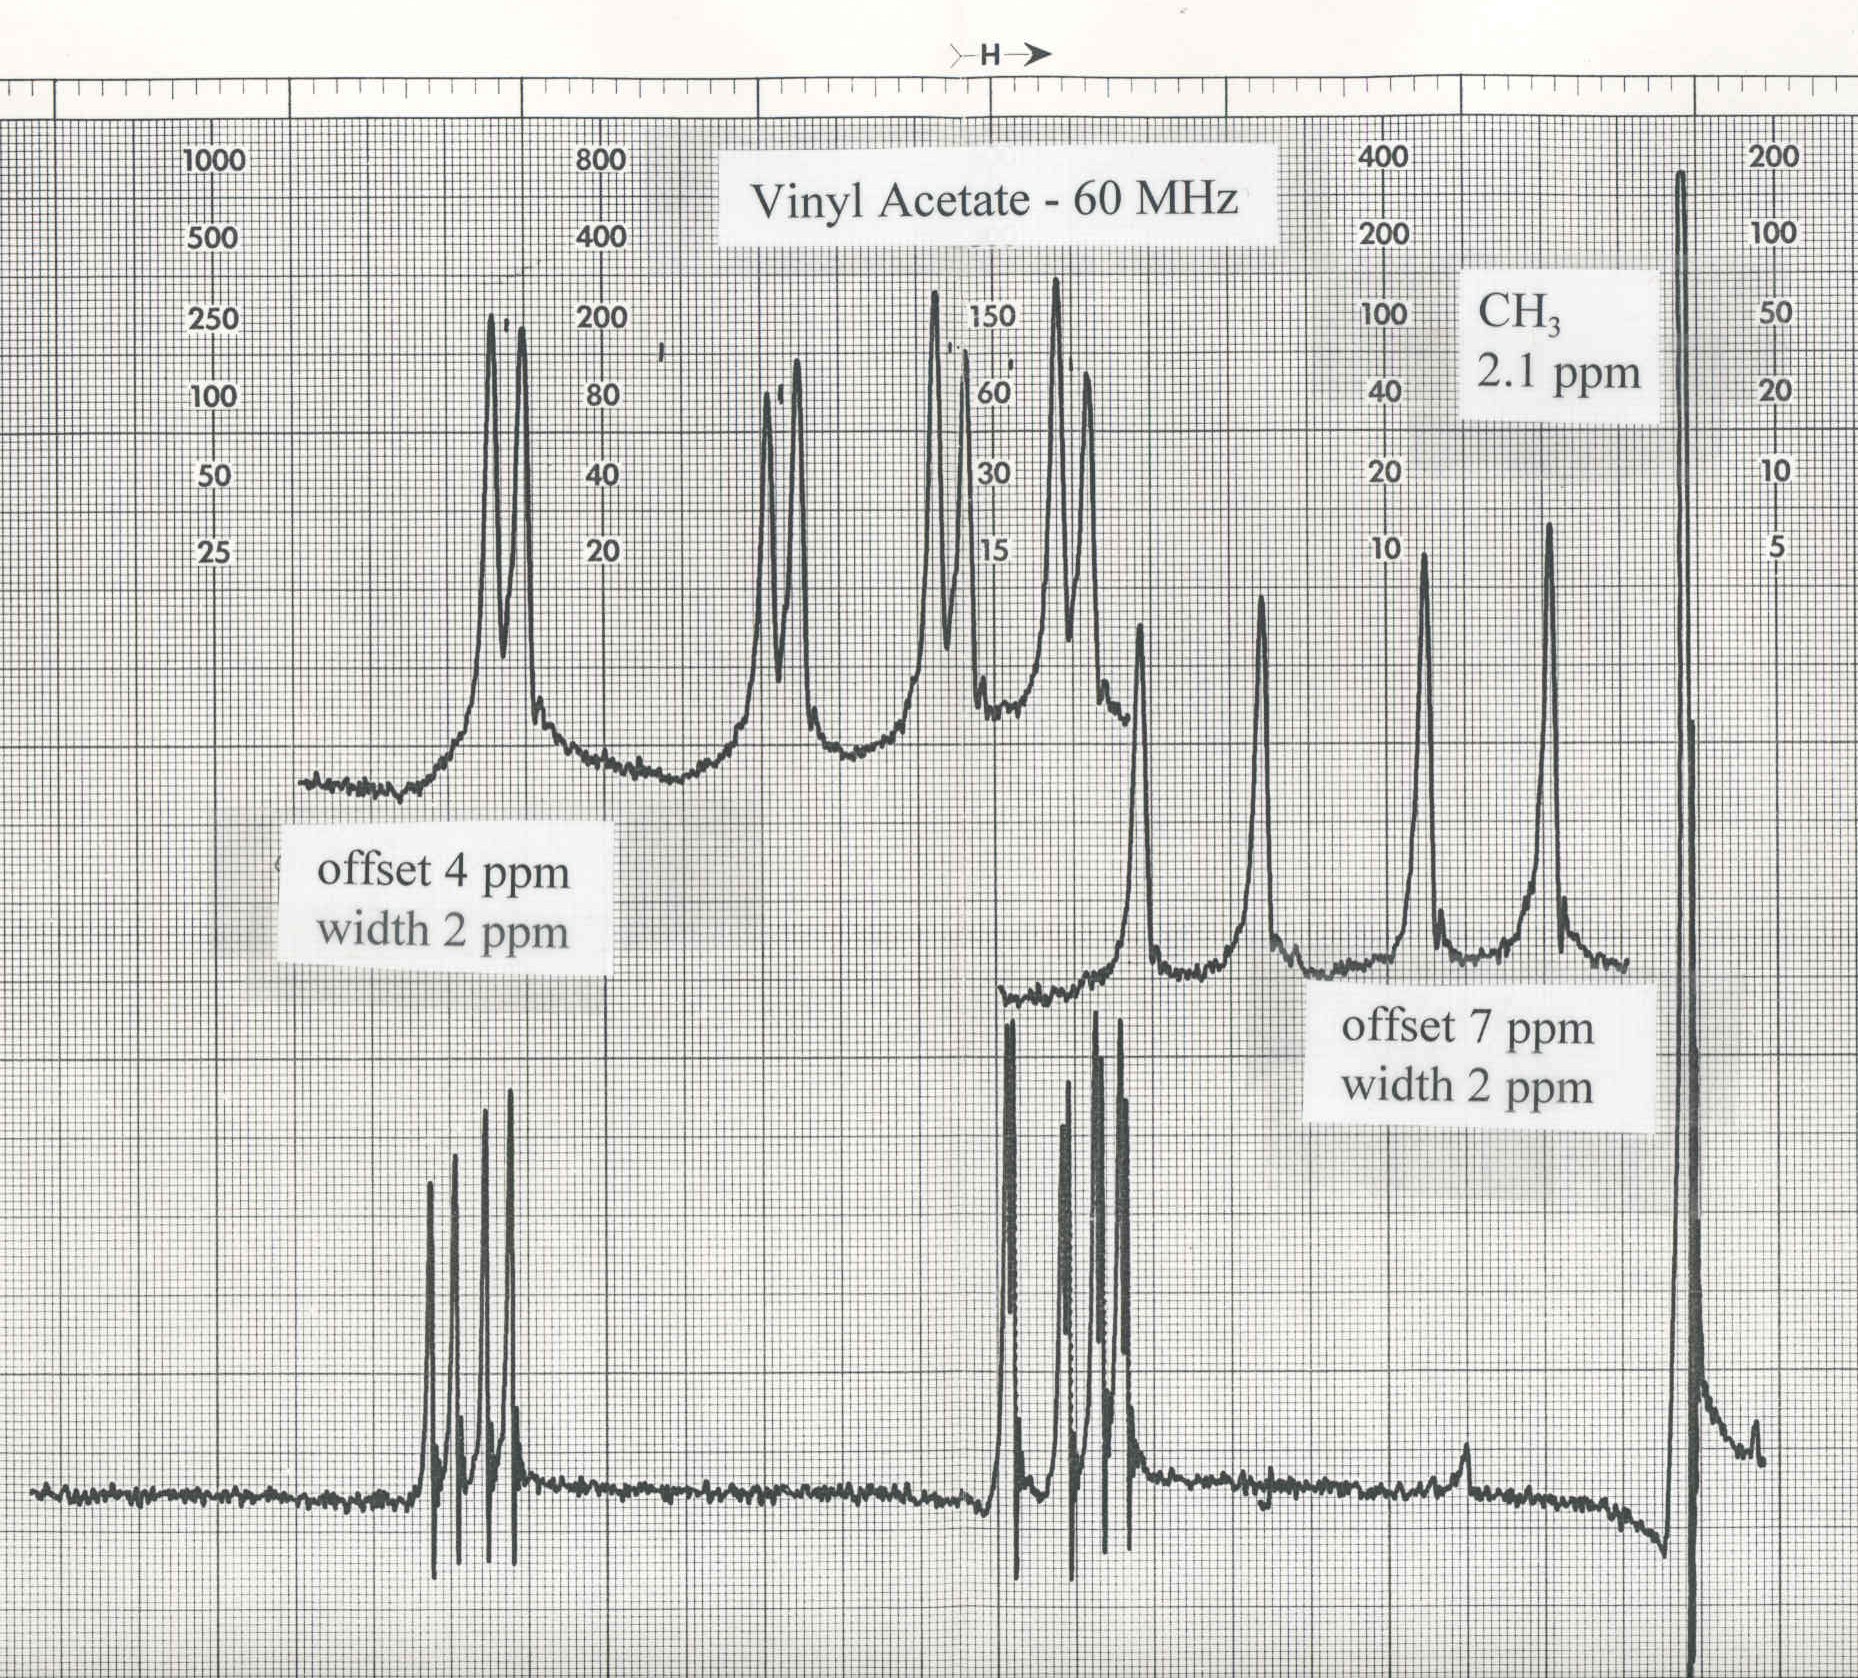
The methyl protons are not coupled to the vinyl protons so it is possible to
treat the vinyl protons as an ABC system. The low field (60 MHz) NMR spectra of
acrylonitrile and vinyl acetate are shown below.
Interpretation of the Spectrum
Acrylonitrile is a true ABC system while the vinyl protons of vinyl acetate
behave like an ABC system because they are not coupled to the methyl
protons. Vinyl acetate presents a classic ABC spectrum. Each proton has a
distinct chemical shift and each proton's resonance is split by the two other
protons. Thus what is observed is a spectrum which consists of three separate
resonances each of which is a quartet of peaks (a doublet of doublets). The
chemical shifts are obtained by locating the center of the doublet of
doublets. The determination of the coupling constants is described below.
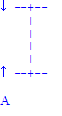
In the absence of any coupling the resonance of an individual proton, A, would
appear as a singlet.
The presence of two non-equivalent protons, X and Y , splits A's singlet into
a quartet of peaks as shown in the diagram below. This occurs because there
are four possible orientations of the non-equivalent protons (up-up,
up-down, down-up, down-down) and, therefore, both the ground state and
excited state of proton A are split into four levels.
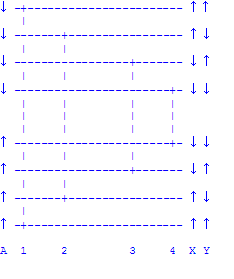
Remember that it is proton A that is undergoing the resonance and that the
spins of X and Y don't flip during A's resonance. That is why there are only
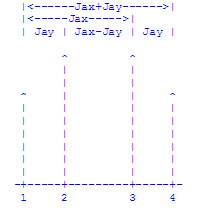
four transitions amongst these eight states. Note that the difference between
transition 1 and 2 is the spin state of proton Y. Thus the frequency
difference between these peaks is the coupling constant Jay expressed in
hertz. Similarly, the difference between 3 and 4 is Jay, the
difference between 1 and 3 is Jax, the difference between 2 and 4 is
Jax, the difference between 1 and 4 is Jax + Jay, and the
difference between 2 and 3 is Jax - Jay. Similar arguments would be
used to discuss the resonances of protons B and C.
To obtain the three coupling constants for vinyl acetate use the following
procedure. Label the doublet of doublets farthest down field "A", the
middle one "B" and the last one "C". The analysis described above
provides you with two direct measurements of two coupling constants. For
example, Jab and Jac can be obtained from the analysis of the "A"
resonance but you don't know which proton is "B" and which one is "C" at this point. However, the
analysis of the "B" resonance provides determinations of Jab and
Jbc. Comparison of the results for "A" and "B" enable you to assign
values to Jab, Jac, and Jbc. Use the average of the four values
for Jab, but hold off on Jac and Jbc until you have analyzed the
resonance of proton "C". This proceedure provides you with four determinations of
Jac and Jbc. Use the average values for each of these parameters.
Assignment
- First compare the 60 MHz NMR spectra of acrylonitrile and vinyl acetate shown below. Notice the
difference in appearance of the spectra in spite of the fact that both spectra show the resonances
of three vinyl protons.
- Use the methods outlined above to obtain chemical shifts and coupling constants from the
vinyl acetate NMR spectrum.
- With assistance, obtain the 300 MHz spectrum of acrylonitile. Note its basic similarity
to the low field vinyl acetate spectrum. Explain why increasing the magnetic field simplifies the
acrylonitrile spectrum. Analyze the spectrum to obtain the chemical shifts and coupling
constants.
- Run the Mathcad program supplied for the low field NMR spectrum of vinyl acetate.
- Use the eigenvalues and eigenvectors generated by Mathcad to construct
an energy level diagram for the eight allowed spin states. Use
the format indicated below for each energy level.
E8 ................................................................ Y8
E7 ................................................................ Y7
E6 ................................................................ Y6
E5 ................................................................ Y5
E4 ................................................................ Y4
E3 ................................................................ Y3
E2 ................................................................ Y2
E1 ................................................................ Y1
- Now use the intensity matrix generated by Mathcad to sketch in the
allowed transitions on the diagram above.
- Also prepare a table which compares the experimental transition
frequencies with the computer generated frequencies given in the frequency
matrix. If you do not find a
favorable comparison it means either that the theoretical model used in this
exercise does not adequately represent the vinyl acetate nuclear spin system
or that you have misread your spectrum.
- Qualitatively compare the appearance of the experimental
spectrum with the model spectrum generated by Mathcad. In other words do you find
satisfactory agreement for the relative values of the frequencies and intensities
for each resonance. Explain.
- Run the Mathcad program supplied for the high field NMR spectrum of acrylonitrile.
- Use the eigenvalues and eigenvectors generated by Mathcad to construct
an energy level diagram for the eight allowed spin states. Use
the format given in 4.1 for each energy level.
- Now use the intensity matrix generated by Mathcad to sketch in the
allowed transitions on the diagram from part 4.1 above.
- Also prepare a table which compares the experimental transition
frequencies with the computer generated frequencies given in the frequency
matrix. If you do not find a
favorable comparison it means either that the theoretical model used in this
exercise does not adequately represent the acrylonitrile nuclear spin system
or that you have misread your spectrum.
- Qualitatively compare the appearance of the experimental
spectrum with the model spectrum generated by Mathcad. In other words do you find
satisfactory agreement for the relative values of the frequencies and intensities
for each resonance. Explain.
- Run the Mathcad program to simulate the low field (60 MHz) spectrum of acrylonitrile.
Do this by dividing the high field chemical shifts by 5 (60 = 300/5). Compare the Mathcad
model spectrum with the experimental 60 MHz spectrum provided.
- Use the eigenvalues and eigenvectors generated by Mathcad to construct
an energy level diagram for the eight allowed spin states. Use
the format given in 4.1 for each energy level.
- Now use the intensity matrix generated by Mathcad to sketch in the
allowed transitions on the diagram from part 4.1 above.
- Qualitatively compare the appearance of the experimental
spectrum with the model spectrum generated by Mathcad. In other words do you find
satisfactory agreement for the relative values of the frequencies and intensities
for each resonance. Explain.
- Before the existence of high field nmr an analysis of the 60 MHz spectrum of
acrylonitrile yielded the following chemical shifts and coupling constants in Hz:
sa = 372.2;
sb = 364.4;
sc = 342.0;
Jab = 0.91; Jac = 17.90; Jbc = 11.75. Compare your
values for the chemical shifts and coupling constants with these values.
- The low-field acrylonitrile spectrom shows that 14 resonances are
observed [a 15th resonance (see intensity matrix) is too weak to be seen experimentally].
The high-field acrylonitrile and low-field vinyl acetate spectra show 12
resonances. Examine the nuclear spin wave functions for all three cases and
use the superposition principle to explain these differences.
To down-load the Mathcad file for this tutorial
click here.
Back to Frank Rioux's homepage.